
Comparing dependencies of popular machine learning packages with `pkgnet`
When looking through the CRAN list of packages, I stumbled upon this little gem:
pkgnet is an R library designed for the analysis of R libraries! The goal of the package is to build a graph representation of a package and its dependencies.
And I thought it would be fun to play around with it. The little analysis I ended up doing was to compare dependencies of popular machine learning packages.
Update: An alternative package to use would be cranly.
- I first loaded the packages:
library(pkgnet)
library(tidygraph)
##
## Attache Paket: 'tidygraph'## The following object is masked from 'package:stats':
##
## filterlibrary(ggraph)## Lade nötiges Paket: ggplot2- I then created a function that will
- create the package report with
pkgnet::CreatePackageReport - convert the edge (
report$DependencyReporter$edges) and node (report$DependencyReporter$nodes) data into a graph object withtidygraph::as_tbl_graph
create_pkg_graph <- function(package_name, DependencyReporter = TRUE) {

  report <- CreatePackageReport(pkg_name = package_name)

  if (DependencyReporter) {
    graph <- as_tbl_graph(report$DependencyReporter$edges,
                      directed = TRUE,
                      nodes = as.data.frame(report$DependencyReporter$nodes))
  } else {
    graph <- as_tbl_graph(report$FunctionReporter$edges,
                      directed = TRUE,
                      nodes = as.data.frame(report$FunctionReporter$nodes))
  }

  return(graph)
}
To create a vector of machine learning packages from R I looked at CRAN’s machine learning task view
These are the packages I ended up including:
pkg_list <- c("caret", "h2o", "e1071", "mlr")Note: I wanted to include other packages, like tensorflow, randomFores, gbm, etc. but for those, pkgnet threw an error:
Error in data.table::data.table(node = names(igraph::V(self$pkg_graph)), : column or argument 1 is NULL
- Next, I ran them through my function from before and assigned them each a unique name.
for (pkg in pkg_list) {
  graph <- create_pkg_graph(pkg)
  assign(paste0("graph_", pkg), graph)
}- These individual objects I combined with
tidygraphand calculated node centrality as the number of outgoing edges.
graph <- graph_caret %>%
  graph_join(graph_h2o, by = "name") %>%
  graph_join(graph_e1071, by = "name") %>%
  graph_join(graph_mlr, by = "name") %>%
  mutate(color = ifelse(name %in% pkg_list, "a", "b"),
centrality = centrality_degree(mode = "out"))- Finally, I plotted the dependency network with
ggraph:
The bigger the node labels (package names), the higher their centrality. Seems like the more basic utilitarian packages have the highest centrality (not really a surprise…).
graph %>%
  ggraph(layout = 'nicely') +
    geom_edge_link(arrow = arrow()) +
    geom_node_point() +
    geom_node_label(aes(label = name, fill = color, size = centrality), show.legend = FALSE, repel = TRUE) +
    theme_graph() +
    scale_fill_brewer(palette = "Set1")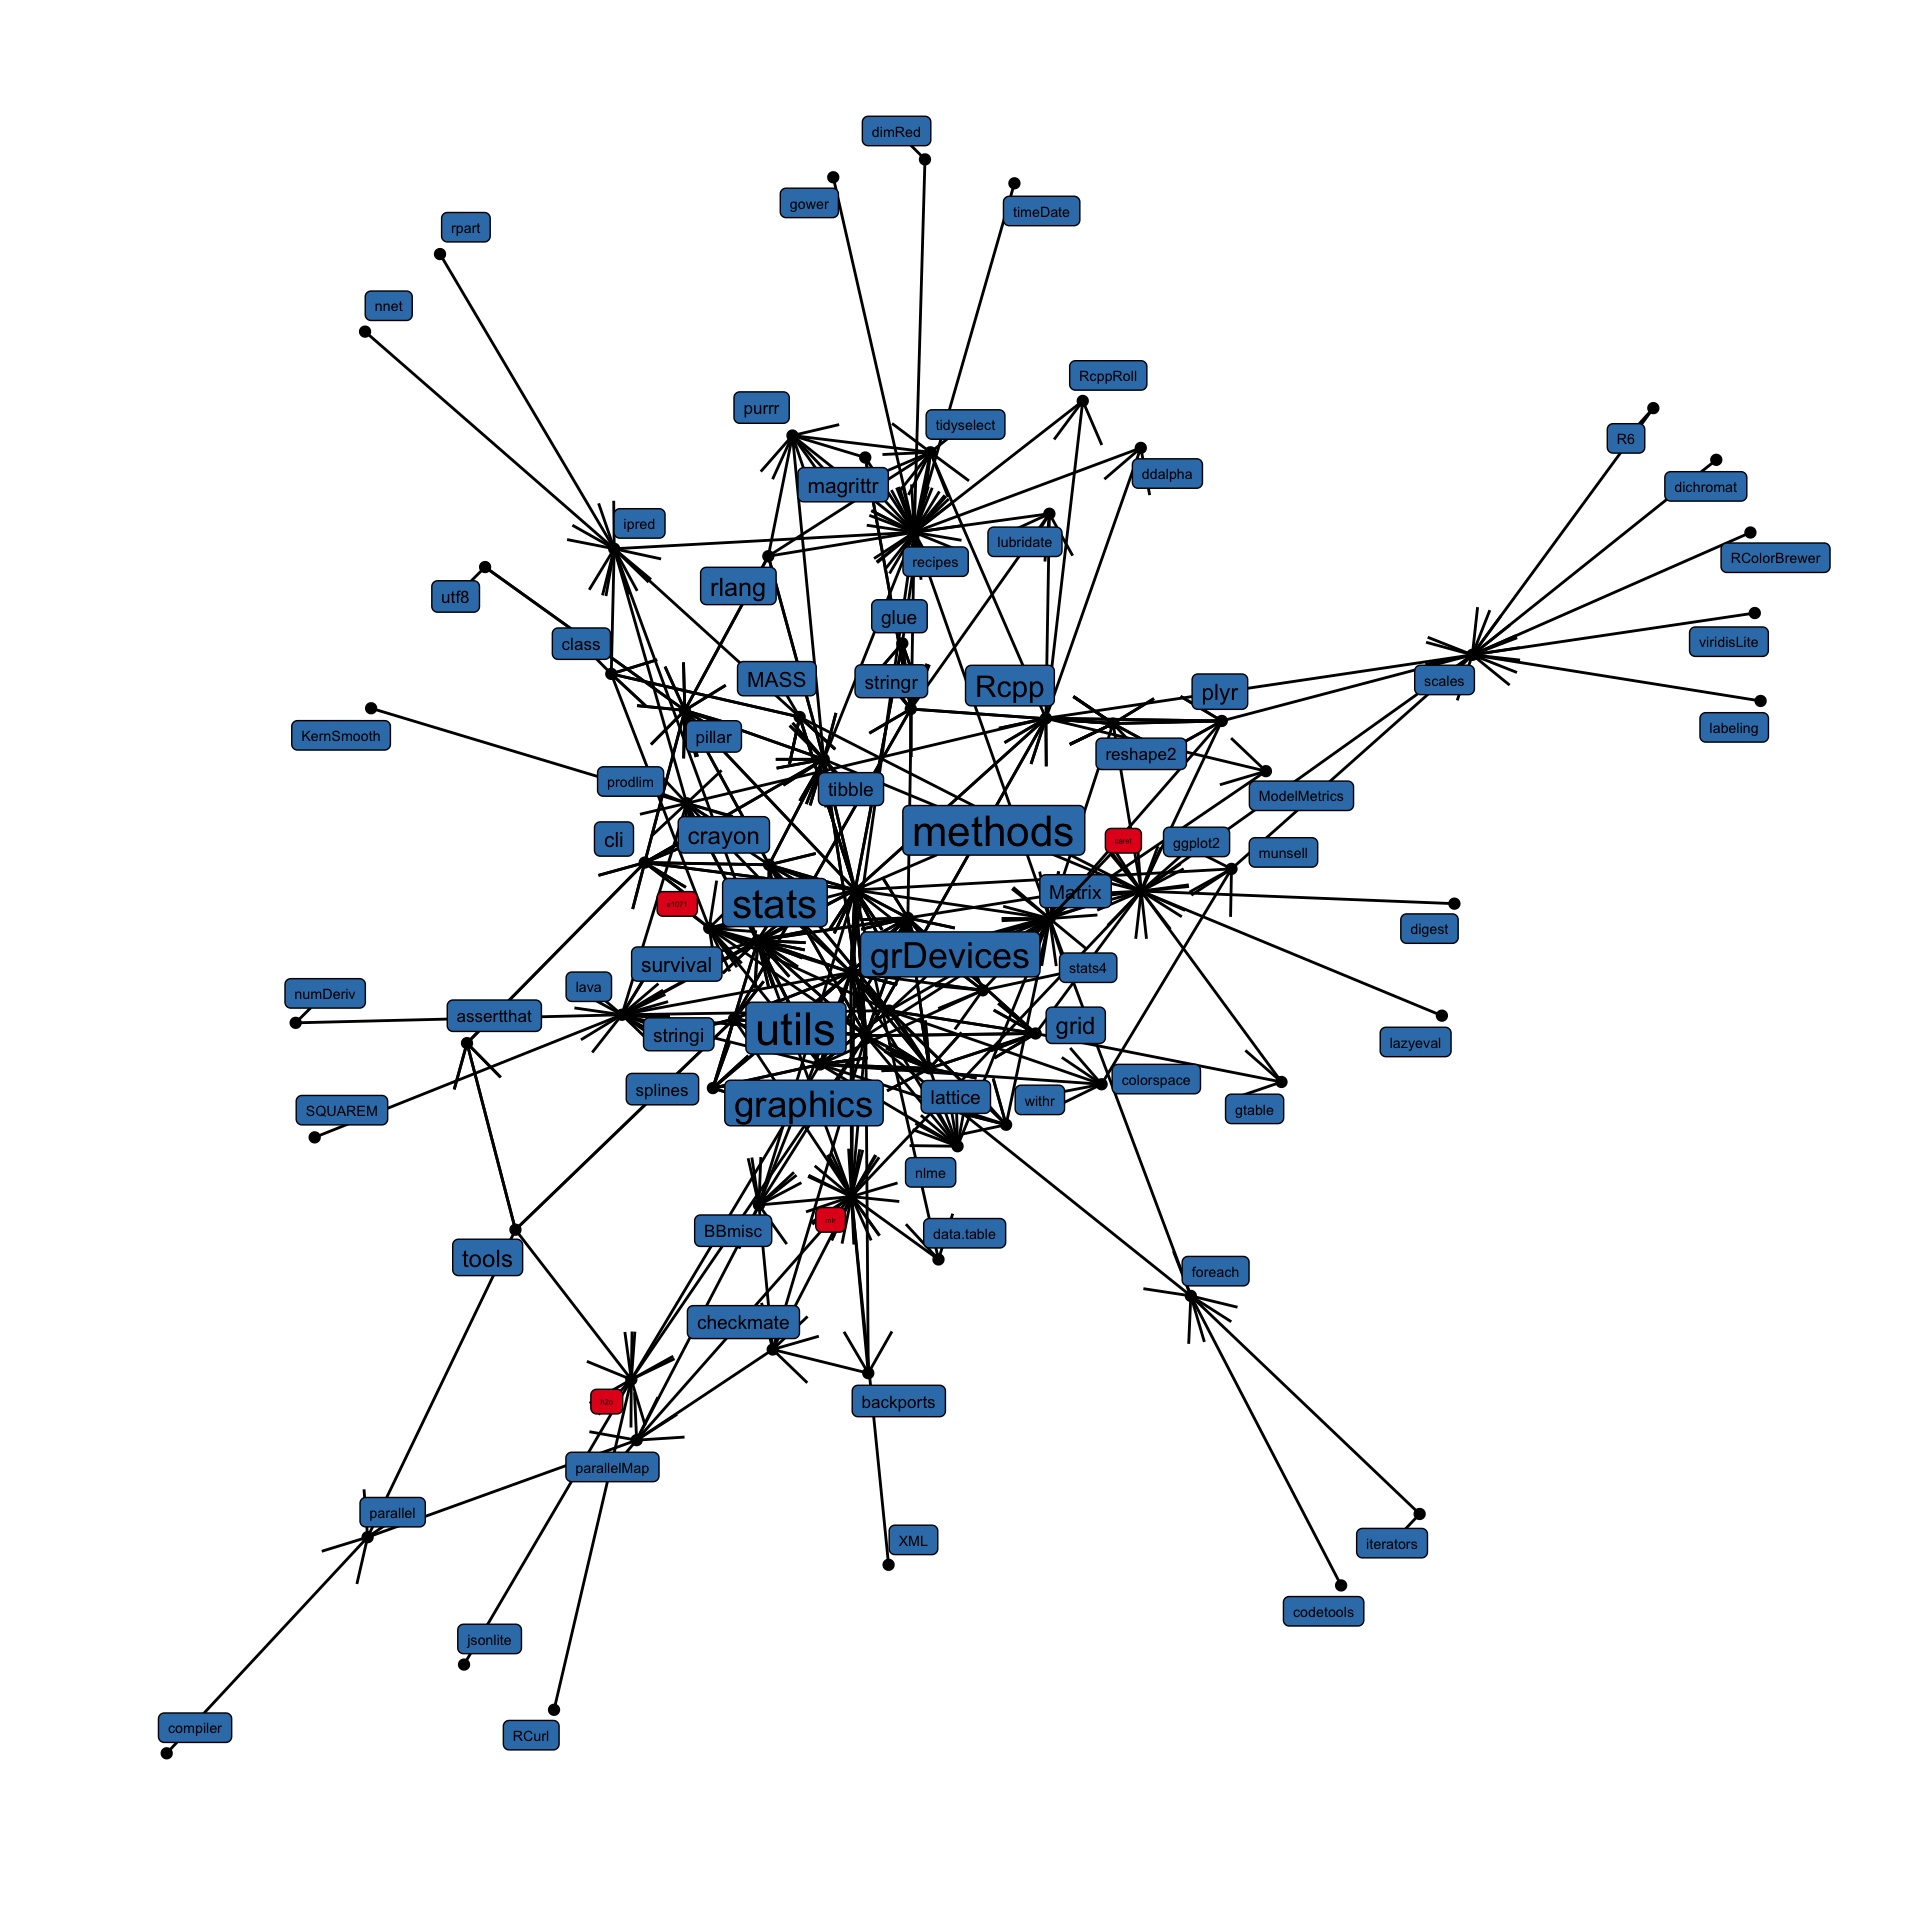
- Because the complete network is a bit hard to make sense of, I plotted it again with only the packages I wanted to analyze plus dependencies that had at least 1 outgoing edge; now it is easier to see shared dependencies.
For example, methods and stats are dependencies of caret, mlr and e1071 but not h2o, while utils is a dependency of all four.
graph %>%
  filter(centrality > 1 | color == "a") %>%
  ggraph(layout = 'nicely') +
    geom_edge_link(arrow = arrow()) +
    geom_node_point() +
    geom_node_label(aes(label = name, fill = color, size = centrality), show.legend = FALSE, repel = TRUE) +
    theme_graph() +
    scale_fill_brewer(palette = "Set1")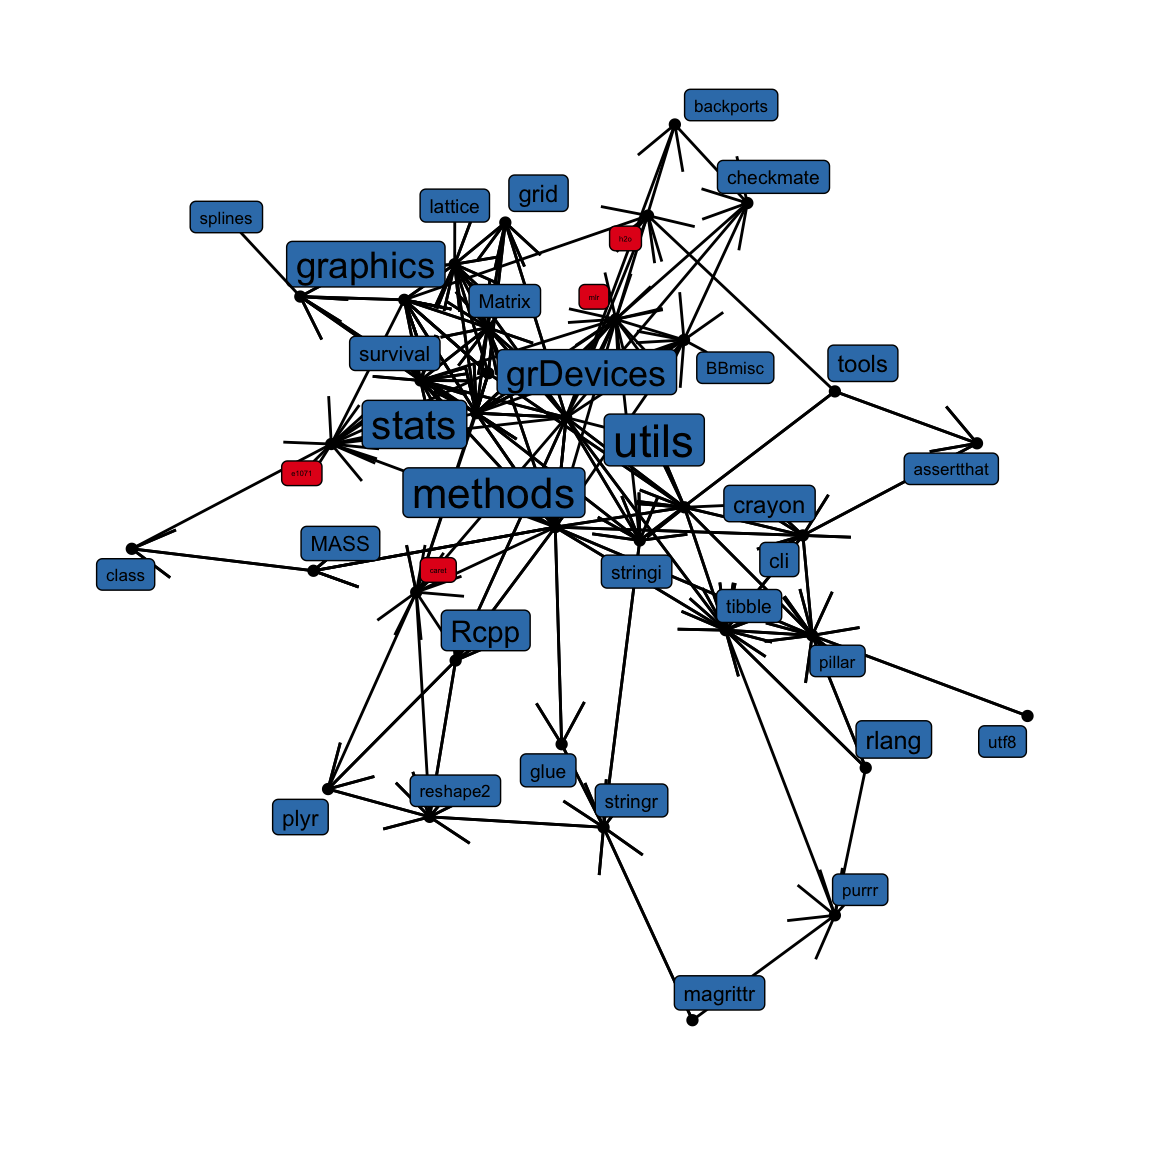
It would of course be interesting to analyse a bigger network with more packages. Maybe someone knows how to get these other packages to work with pkgnet?
sessionInfo()## R version 3.5.0 (2018-04-23)
## Platform: x86_64-apple-darwin15.6.0 (64-bit)
## Running under: macOS High Sierra 10.13.4
##
## Matrix products: default
## BLAS: /Library/Frameworks/R.framework/Versions/3.5/Resources/lib/libRblas.0.dylib
## LAPACK: /Library/Frameworks/R.framework/Versions/3.5/Resources/lib/libRlapack.dylib
##
## locale:
## [1] de_DE.UTF-8/de_DE.UTF-8/de_DE.UTF-8/C/de_DE.UTF-8/de_DE.UTF-8
##
## attached base packages:
## [1] stats graphics grDevices utils datasets methods base
##
## other attached packages:
## [1] bindrcpp_0.2.2 ggraph_1.0.1 ggplot2_2.2.1 tidygraph_1.1.0
## [5] pkgnet_0.2.0
##
## loaded via a namespace (and not attached):
## [1] Rcpp_0.12.16 RColorBrewer_1.1-2 plyr_1.8.4
## [4] compiler_3.5.0 pillar_1.2.2 formatR_1.5
## [7] futile.logger_1.4.3 bindr_0.1.1 viridis_0.5.1
## [10] futile.options_1.0.1 tools_3.5.0 digest_0.6.15
## [13] viridisLite_0.3.0 gtable_0.2.0 jsonlite_1.5
## [16] evaluate_0.10.1 tibble_1.4.2 pkgconfig_2.0.1
## [19] rlang_0.2.0 igraph_1.2.1 ggrepel_0.7.0
## [22] yaml_2.1.18 blogdown_0.6 xfun_0.1
## [25] gridExtra_2.3 stringr_1.3.0 dplyr_0.7.4
## [28] knitr_1.20 htmlwidgets_1.2 grid_3.5.0
## [31] rprojroot_1.3-2 glue_1.2.0 data.table_1.10.4-3
## [34] R6_2.2.2 rmarkdown_1.9 bookdown_0.7
## [37] udunits2_0.13 tweenr_0.1.5 tidyr_0.8.0
## [40] purrr_0.2.4 lambda.r_1.2.2 magrittr_1.5
## [43] units_0.5-1 MASS_7.3-49 scales_0.5.0
## [46] backports_1.1.2 mvbutils_2.7.4.1 htmltools_0.3.6
## [49] assertthat_0.2.0 ggforce_0.1.1 colorspace_1.3-2
## [52] labeling_0.3 stringi_1.1.7 visNetwork_2.0.3
## [55] lazyeval_0.2.1 munsell_0.4.3